How can we better monitor building performance under highly specific real conditions, and use the data to inform design decisions?
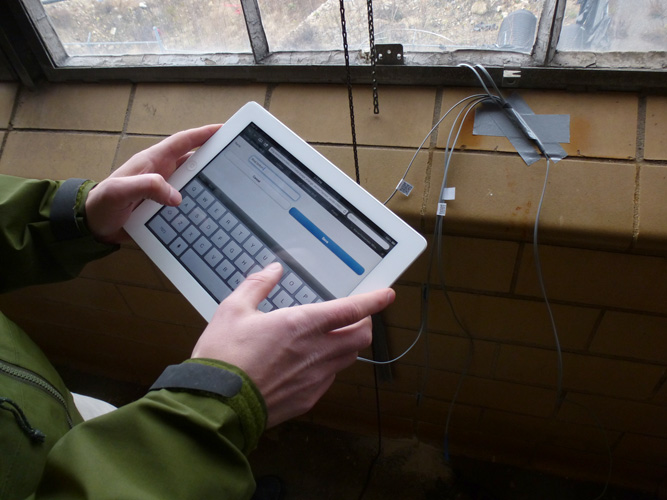
Researchers use a tablet to name each Pointelist™ sensor placed within a wall. Once each sensor is named and installed, the program's interface can then be used to track data remotely.
The human body monitors its environment with an incredible degree of sensitivity. Warmth, breathing rate, heart rate, and comfort level are monitored with a constant feedback loop. Compared to this sophisticated system, however, architects' ability to monitor the built environment is extremely limited.
Traditionally, architects' design decisions are based on assumptions regarding building performance and behavior. Designers often use regional climatic data from the flat landscape of airports to predict temperatures in vastly different urban environments. While these assumptions provide a general idea of a building's surroundings, and consequently its performance, they do not account for the spectrum of real conditions that a building will experience over its lifetime within the specific microclimate of a particular site.
Instead of using regional climatic data, researchers and designers at KieranTimberlake set out to find a way to collect data from specific spaces. The firm used its own projects as test beds, executing several monitoring experiments since 2007 with the goal of gaining real feedback that can be used to inform design. Using commercially available sensors, the team deployed networks to gain valuable data including the temperature fluctuations between layers of experimental materials in wall assemblies; the temperature, relative humidity, and ambient conditions of a specific site; the thermal resistance in existing masonry envelopes; and the temperature and moisture content of a concrete foundation. This data was then used to calibrate energy models, giving designers a platform in which they could make informed decisions about daylighting strategies, natural ventilation, and building orientation and massing.
The results of these experiments proved to be especially relevant to building retrofits. Because retrofits usually include the addition of high-energy systems like air conditioning and lighting, the energy use of these buildings tends to rise regardless of the high performance or energy efficiency of their modifications. The design choices informed by the sensor data, however, have the potential to offset the energy increases that retrofitted buildings often experience, resulting in a more sustainable building overall.
The team's experiments also revealed the shortcomings of the commercially available sensor technology used. Problems included a high cost per data point, malfunctioning equipment, the inability to remotely access data, and a lack and data storage and retrieval. Additionally, while commercially available sensors do generate data, they do not provide software to manage and synthesize this data. Without software support, analyzing the data in order to inform decision making became a complicated and difficult process.
With these challenges in mind, the firm initiated a project with two main goals: first, the team sought to simplify sensor deployment by creating an easy-to-install, plug-and-play network that could receive data wirelessly and could be viewed in a web interface. Second, the group set out to develop software tools to analyze the sensor data. Using an iterative process, the team assembled a series of prototypes over a period of nearly two years, field testing each generation in KieranTimberlake's office and building projects. Feedback collected after each deployment was incorporated into the next generation as the team refined the technology for low cost and ease of use.

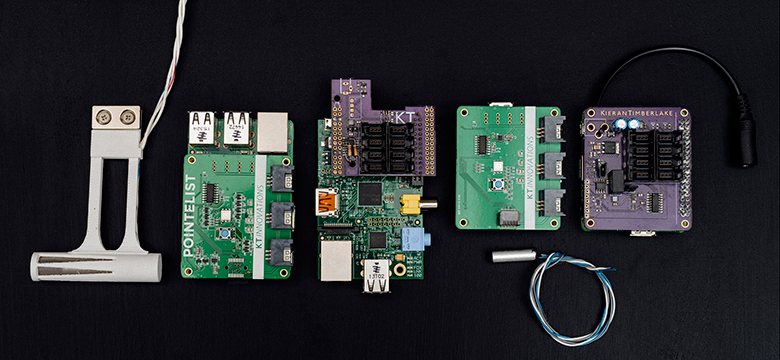
The iterative design process resulted in many prototypes, each developed to resolve very specific issues. Above, Pointelist Generations 1-6 (left to right) show how the network has changed over time.
After integrating control and communications directly into the network's transmitter, or node, researchers next addressed manufacturability through design and component selection. While work on the physical node continued, the network's web-based interface, which includes data storage and viewing software, continued to be refined. The interface's analysis capabilities took shape, focusing on thermal characteristic assessments and an increased speed of data access. Through this development, the team sought to not just to produce raw data, but to help users manage and digest this data in useful and relevant ways.
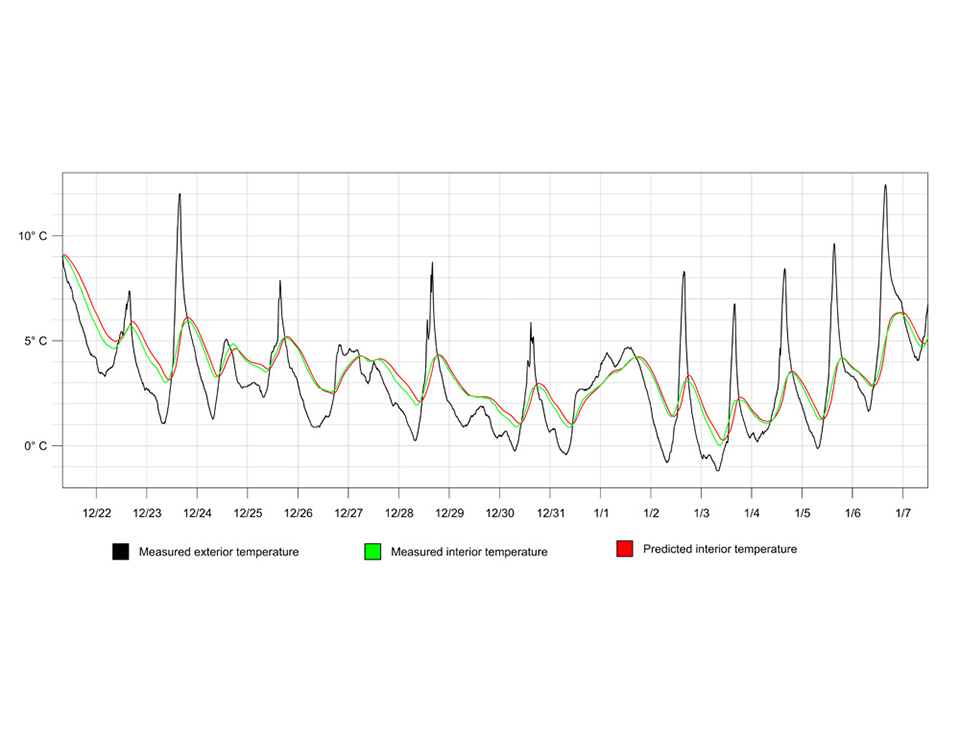
An early version of the interface, shown above, demonstrates how Pointelist sensors record temperature variations over time while also giving users the ability to track the data remotely.
The resulting product is Pointelist™, a high-density and configurable sensor network that allows users to collect and analyze their space. In addition to monitoring temperature and relative humidity, the comprehensive sensor network includes an interface that allows users to display their data in a variety of ways to serve a variety of different purposes. The easy-to-use interface can be extended to meet a wide variety of custom analysis needs through formatted downloads, a Rhino3D Grasshopper plugin, or web application programming interface (REST API).
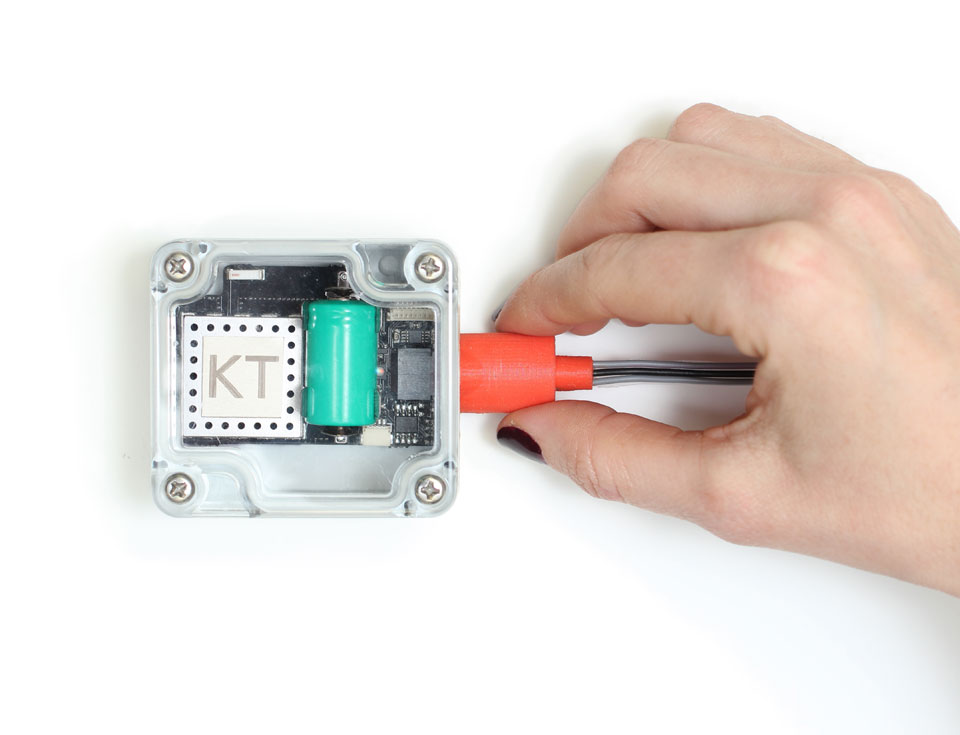
This Generation 7 Pointelist node is one of multiple generations that were developed before the beta version was released for testing.
To learn more about Pointelist, click here.
Additional Publications
This project has been shared via the following publication:
- Energy Accounts: Architectural Representations of Energy, Climate, and the Future, "Bounding. More or Less.” Faircloth and Welch, 2016